Kategorien
Interessante Beiträge

Textur Analyse

https://graphics.stanford.edu/projects/texture/
Texture Analysis and Synthesis


Input Sample

Synthesized Result


Introduction

Texture is a ubiquitous visual experience. It can describe a wide variety of surface characteristics such as terrain, plants, minerals, fur and skin. Since reproducing the visual realism of the real world is a major goal for computer graphics, textures are commonly employed when rendering synthetic images. These textures can be obtained from a variety of sources such as hand-drawn pictures or scanned photographs. Hand-drawn pictures can be aesthetically pleasing, but it is hard to make them photo-realistic. Most scanned images, however, are of inadequate size and can lead to visible seams or repetition if they are directly used for texture mapping.Texture synthesis is an alternative way to create textures. Because synthetic textures can be made of any size, visual repetition is avoided. Texture synthesis can also produce tileable images by properly handling the boundary conditions. Potential applications of texture synthesis are also broad; some examples are image de-noising, occlusion fill-in, and compression.

The problem of texture synthesis can be stated as follows: Given a texture sample, synthesize a new texture that, when perceived by a human observer, appears to be generated by the same underlying stochastic process. An example is shown in the above figure. Our goal is to develope a new texture synthesis algorithm that is efficient, general, user-friendly, and able to produce high quality textures. In addition, we would like to extend the horizon of texture synthesis by exploring a variety of new applications based on our algorithm.

People

Li-Yi Wei
Marc Levoy

Zum Download:

„Texture Synthesis from Multiple Sources“, by Li-Yi Wei. In SIGGRAPH 2003 Applications and Sketches.
Summary

Kategorien
Interessante Beiträge

Lost & Found: Protected Interactive 3D Graphics Via Remote Rendering

David Koller, Michael Turitzin, Marc Levoy (Stanford University),
Marco Tarini, Giuseppe Croccia, Paolo Cignoni, and Roberto Scopigno (ISTI-CNR, Italy)

Proceedings of ACM SIGGRAPH 2004

Abstract:

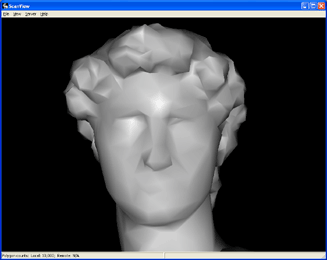
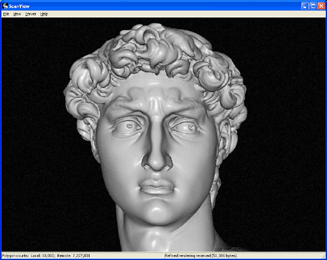
Valuable 3D graphical models, such as high-resolution digital scans of cultural heritage objects, may require protection to prevent piracy or misuse, while still allowing for interactive display and manipulation by a widespread audience. We have investigated techniques for protecting 3D graphics content, and we have developed a remote rendering system suitable for sharing archives of 3D models while protecting the 3D geometry from unauthorized extraction. The system consists of a 3D viewer client that includes low-resolution versions of the 3D models, and a rendering server that renders and returns images of high-resolution models according to client requests. The server implements a number of defenses to guard against 3D reconstruction attacks, such as monitoring and limiting request streams, and slightly perturbing and distorting the rendered images. We consider several possible types of reconstruction attacks on such a rendering server, and we examine how these attacks can be defended against without excessively compromising the interactive experience for non-malicious users.

Paper

Video

Kategorien
Interessante Beiträge

Lost & Found : Spreadsheets for images


Spreadsheets for images

Marc Levoy, Proc. SIGGRAPH ’94 (Orlando, Florida, July 24-29, 1994). In Computer Graphics Proceedings, Annual Conference Series, 1994, ACM SIGGRAPH, pp. 139-146.

Abstract:

We describe a data visualization system based on spreadsheets. Cells in our spreadsheet contain graphical objects such as images, volumes, or movies. Cells may also contain widgets such as buttons, sliders, or curve editors. Objects are displayed in miniature inside each cell. Formulas for cells are written in a general-purpose programming language (Tcl) augmented with operators for array manipulation, image processing, and rendering.

Compared to flow chart visualization systems, spreadsheets are more expressive, more scalable, and easier to program. Compared to conventional numerical spreadsheets, spreadsheets for images pose several unique design problems: larger formulas, longer computation times, and more complicated intercell dependencies. In response to these problems, we have extended the spreadsheet paradigm in three ways: formulas can display their results anywhere in the spreadsheet, cells can be selectively disabled, and multiple cells can be edited at once. We discuss these extensions and their implications, and we also point out some unexpected uses for our spreadsheets: as a visual database browser, as a graphical user interface builder, as a smart clipboard for the desktop, and as a presentation tool.

Additional information available:

  • PDF file (size of images differs slightly from printed version) (1.7 MB)

The URL of this page is http://www-graphics.stanford.edu/papers/spreadsheets/